Measuring What Matters
How Cisco IP SLA Turns Your Network from Assumption into Evidence
You cannot improve what you do not measure.
You cannot react to what you do not detect.
IP SLA gives your network the ability to tell you what is happening — before your users do.
There is a question that separates networks that are managed from networks that are understood: how do you know your network is healthy right now? Not an hour ago, when the last monitoring check ran. Not this morning, when someone manually ran a ping. Right now.
Most network teams rely on reactive indicators. An interface goes down and SNMP sends a trap. A user calls because their video call is choppy. A ticket comes in about slow application performance. By the time you know there is a problem, your users already know — and their experience of IT has already been shaped by the failure.
Cisco’s IP SLA (Internet Protocol Service Level Agreement) offers a fundamentally different approach. Instead of waiting for symptoms, it generates synthetic test traffic that continuously probes the network, measuring latency, jitter, packet loss, and connectivity in real time. It is the difference between checking your blood pressure once a year and wearing a monitor that tracks it continuously. One gives you a snapshot. The other gives you a story.
What IP SLA Actually Does
IP SLA is a feature embedded in Cisco IOS that turns your routers and switches into active performance monitoring agents. It works by generating test packets that simulate real application traffic — ICMP pings, UDP datagrams, TCP connections, HTTP requests — and sending them across the network to a destination. The destination responds, and the source device measures how long the round trip took, how much variation there was in the timing, and whether any packets were lost along the way.
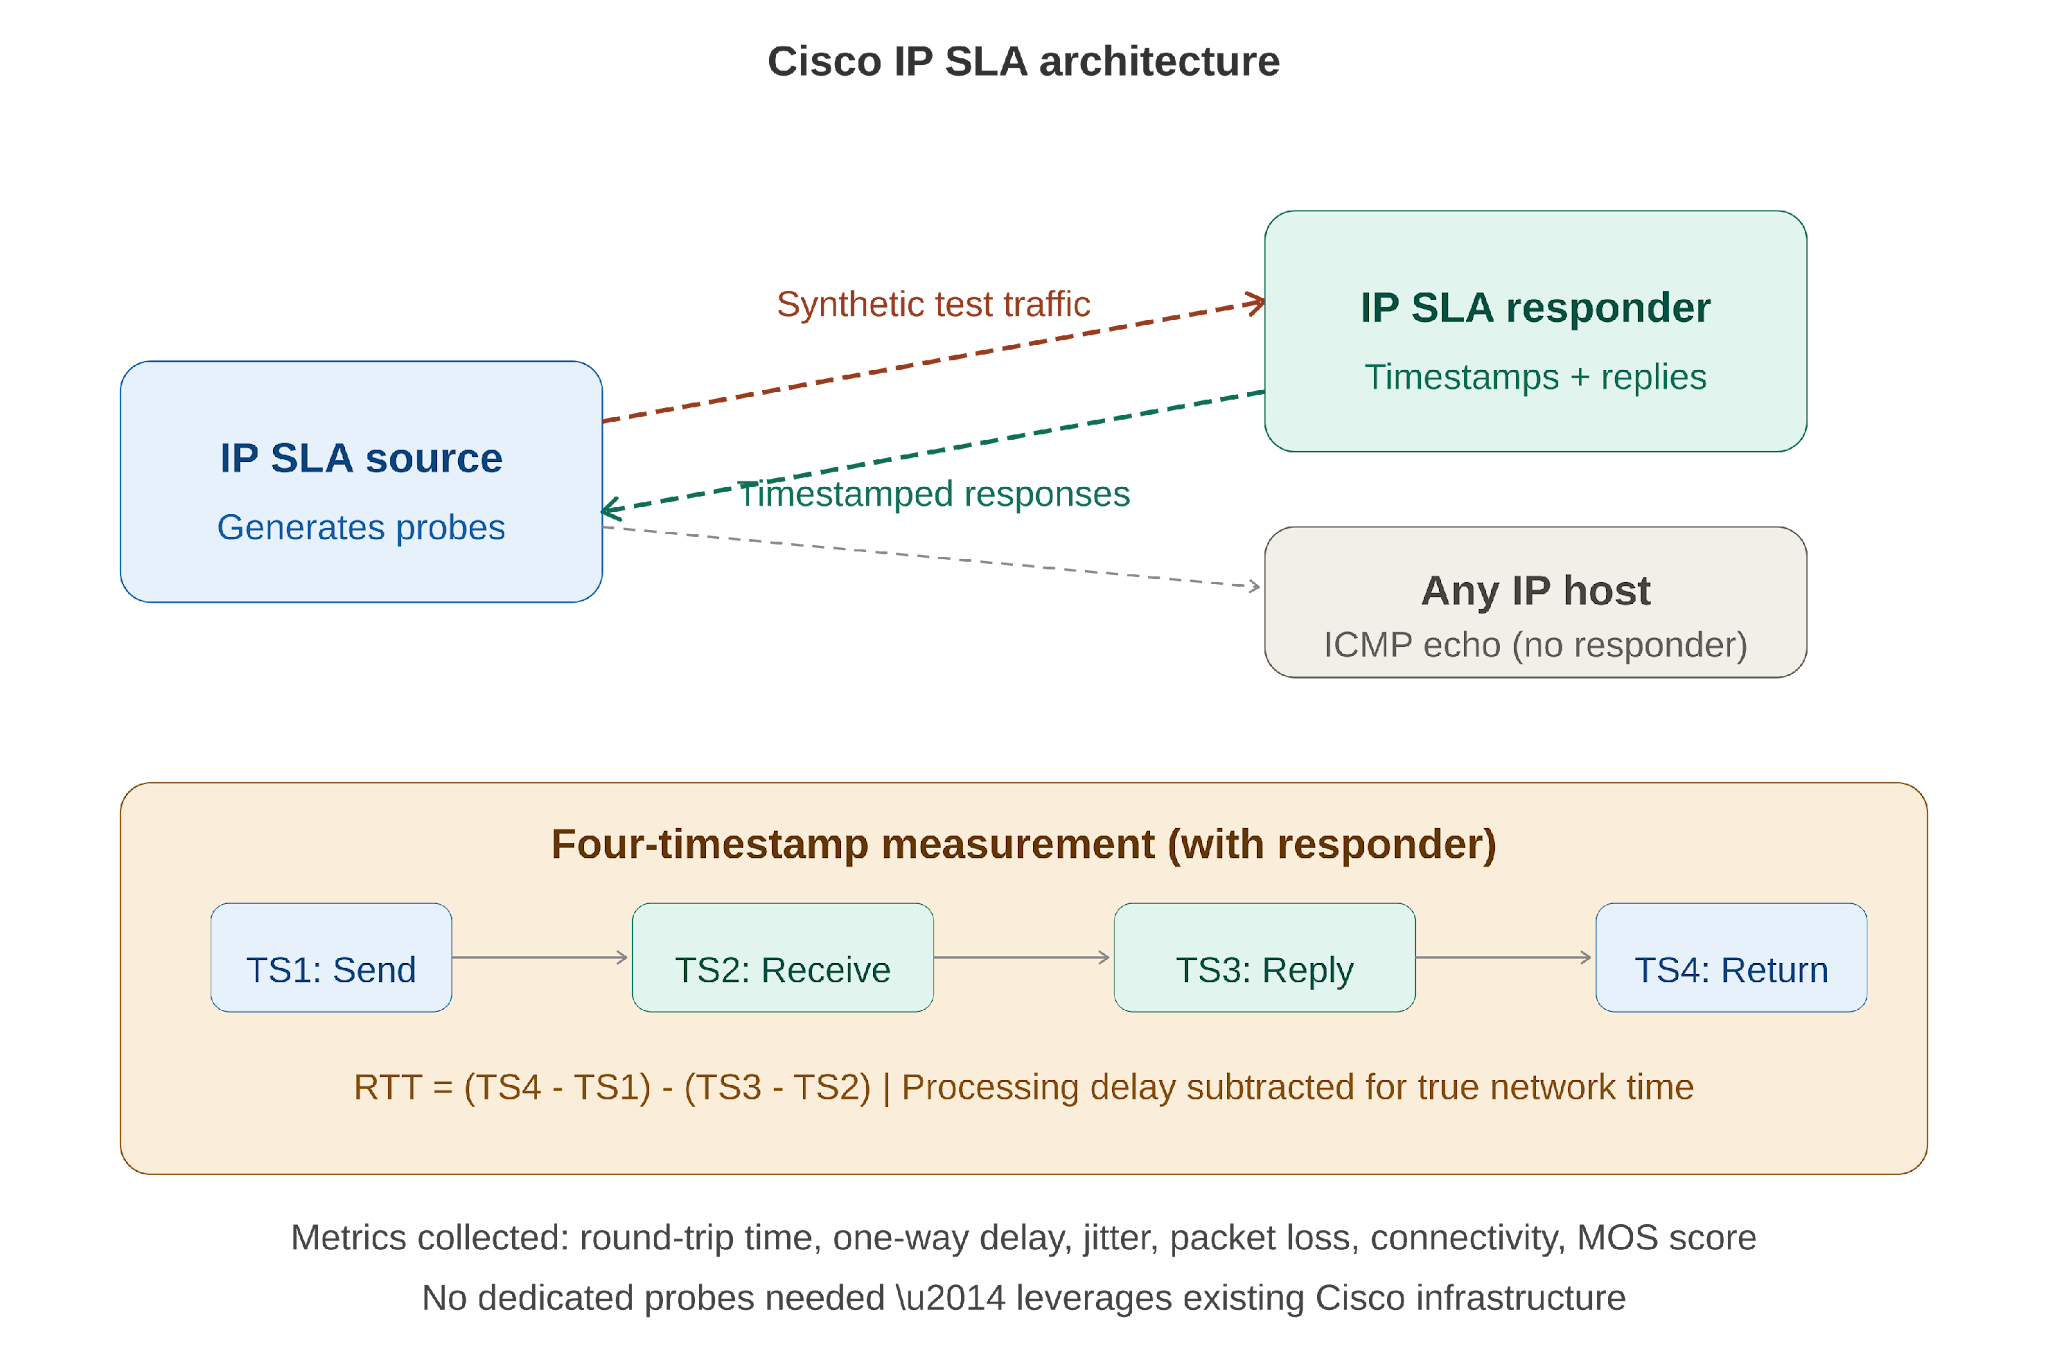
The key innovation is the IP SLA Responder — a software component embedded in destination Cisco devices that provides precision timestamping. When a responder receives a test packet, it records when the packet arrived (TS2) and when the reply was sent (TS3). This allows the system to subtract the processing delay at the destination from the overall round-trip time, giving you the true network delay rather than a number inflated by router processing queues.

Figure 1: IP SLA architecture — source generates probes, responder timestamps responses, four-timestamp measurement subtracts processing delay.
The four-timestamp mechanism is what makes IP SLA measurements meaningfully more accurate than a simple ping. Routers process many tasks simultaneously, and incoming packets can sit in queues for milliseconds before being handled. Without the responder’s timestamps, those processing delays would be counted as network delay — giving you false readings that could mask or exaggerate real problems.
An important practical note: the responder is only available on Cisco devices. For non-Cisco targets — servers, cloud endpoints, third-party equipment — you can still run IP SLA operations using native services like ICMP echo or TCP connect. You lose the precision of the four-timestamp mechanism, but you still gain continuous, automated measurement that is far superior to manual testing.
Operation Types: Choosing the Right Probe
IP SLA supports multiple operation types, each designed to measure a different aspect of network performance. The choice depends on what you need to know and what the target device supports.

Figure 2: Six common IP SLA operation types — from basic ICMP echo to application-layer HTTP testing.
ICMP Echo is the simplest and most widely used operation. It measures round-trip time and reachability to any IP-addressable device. No responder is needed. This is your baseline probe — the equivalent of a continuous, automated ping that runs every few seconds and records the results.
UDP Echo measures application-layer round-trip time by sending UDP datagrams to a specific port. A responder is recommended for accuracy. This is useful for testing UDP-based applications or measuring delay to specific services.
UDP Jitter is the most powerful operation for voice and video quality assessment. It sends a stream of UDP packets and measures not just round-trip time but jitter (the variation in packet arrival times), one-way delay in each direction, and directional packet loss. A responder is required. This operation is essential for any environment running VoIP or video conferencing — it tells you whether the network can support real-time communication before your users tell you it cannot.
TCP Connect measures the time to complete a TCP three-way handshake to a specified port. No responder needed. This is ideal for testing whether an application server is accepting connections and how quickly it responds — web servers, database servers, cloud services.
HTTP measures the full round-trip time for an HTTP GET request, including DNS resolution, TCP connection setup, and HTTP transaction time. This gives you the end-to-end perspective of a user accessing a web application.
ICMP Jitter provides jitter measurements using ICMP timestamp requests rather than UDP. The advantage is that no responder is needed, making it usable with non-Cisco targets. The tradeoff is slightly less precision than UDP jitter with a responder.
IP SLA + Object Tracking: Intelligent Failover
IP SLA becomes genuinely transformative when combined with object tracking — a feature that allows routing decisions, HSRP priority, and static route validity to be tied to the results of IP SLA probes.
Consider a common scenario: your edge router has two WAN connections — a primary MPLS link and a backup internet circuit. Traditionally, failover depends on the physical interface state. If the MPLS interface goes down, the backup route activates. But what if the MPLS link is up at the physical layer but the provider’s backbone is experiencing severe packet loss? The interface is up. The routing table sees the route. Traffic flows into a degraded path. Your users suffer, but your router thinks everything is fine.

Figure 3: IP SLA probes detect path degradation even when the interface is up — triggering automatic failover to the backup path.
IP SLA solves this by testing end-to-end reachability, not just interface state. You configure an IP SLA probe that sends ICMP echo packets through the primary link to a known destination — the provider’s next-hop, a core router, or even a public DNS server. You create a tracked object that monitors the probe’s results. You then tie your primary static route to that tracked object.
When the probe succeeds, the tracked object is UP and the primary route is active. When the probe fails — because the path is degraded, not just because the interface is down — the tracked object goes DOWN, the primary route is removed from the routing table, and the backup route through the internet circuit takes over automatically.
This same mechanism integrates with HSRP. If an IP SLA probe detects that the active router’s upstream path is degraded, the router’s HSRP priority can be automatically decremented, triggering a failover to the standby router that may have a healthier path. The network becomes self-aware and self-correcting.
The Leadership Principle: Measure Before You Manage
IP SLA embodies a principle that applies far beyond networking: you cannot manage what you do not measure, and you cannot improve what you measure only after it breaks.
In my own work leading IT operations, one of the first things I prioritized was moving from gut-feel management to data-driven operations — centralizing assets, building dashboards, establishing baselines. IP SLA is the network equivalent of that same transformation. It takes your infrastructure from a system that reports failures to a system that detects trends. It is the difference between reactive operations and proactive operations, and that difference is what separates an IT team that fights fires from one that prevents them.
Every probe you configure is a question you are asking your network continuously: are you healthy? Is this path performing? Can you support this application? The network answers every few seconds. And when the answers start changing — when latency creeps up, when jitter increases, when packet loss appears — you know before anyone calls. You act before anyone notices.
That is what operational maturity looks like. Not the absence of problems, but the presence of awareness.
Getting Started: A Practical Path
If you are new to IP SLA, start simple. Configure a single ICMP echo operation to a critical destination — your default gateway, your WAN provider’s next-hop, or a cloud service endpoint. Schedule it to run continuously. Check the results. This alone gives you more visibility than most IT teams have.
Then layer on complexity as the need arises. Add UDP jitter probes for your VoIP paths. Add TCP connect probes for your critical application servers. Connect IP SLA to object tracking for automatic failover. Integrate the results with SNMP traps so your monitoring system can visualize threshold violations in real time.
The beauty of IP SLA is that it requires no additional hardware. It runs on the Cisco infrastructure you already have. The only cost is the time to configure it — and that time is a Quadrant 2 investment that pays dividends every time a problem is detected before it becomes a crisis.
Cisco IP SLA Command Cheatsheet
Quick reference for configuring, scheduling, tracking, and verifying IP SLA operations on Cisco IOS.
Enable IP SLA responder (on destination device)
ip sla responder
Enables the device to respond to IP SLA probe packets with precision timestamps. Configure this on the target Cisco device.
Basic ICMP echo operation
ip sla 1
icmp-echo 10.1.1.1 source-interface GigabitEthernet0/1
frequency 10
Creates operation 1: pings 10.1.1.1 every 10 seconds from Gi0/1. No responder needed.
UDP jitter operation (VoIP testing)
ip sla 2
udp-jitter 10.1.1.2 16384 num-packets 100 interval 20
frequency 30
Sends 100 UDP packets at 20ms intervals to port 16384, every 30 seconds. Measures jitter, latency, packet loss. Responder required on target.
TCP connect operation
ip sla 3
tcp-connect 192.168.1.100 443
frequency 60
Tests TCP handshake to port 443 (HTTPS) every 60 seconds. No responder needed. Measures connection setup time.
HTTP operation
ip sla 4
http get http://intranet.company.com
frequency 120
Performs an HTTP GET every 2 minutes. Measures DNS + TCP + HTTP response time. No responder needed.
Schedule an operation
ip sla schedule 1 life forever start-time now
Starts operation 1 immediately and runs indefinitely. Use ‘life <seconds>’ to set a duration instead.
Schedule with start time
ip sla schedule 2 start-time 08:00 Jan 15 2026 life forever
Schedules operation 2 to start at a specific date and time.
Set operation timeout and threshold
ip sla 1
timeout 2000
threshold 1000
Timeout: max wait for response (ms). Threshold: value above which the operation is considered degraded.
Configure ToS/DSCP marking
ip sla 2
tos 184
Sets Type of Service byte to 184 (DSCP EF / Expedited Forwarding). Ensures probe packets match VoIP QoS treatment.
Object Tracking and Route Integration
Create a tracked object from IP SLA
track 1 ip sla 1 reachability
Creates track object 1 that monitors whether IP SLA operation 1 is reachable (probe succeeds).
Track with delay (debounce)
track 1 ip sla 1 reachability
delay down 15 up 30
Waits 15 seconds before declaring DOWN, 30 seconds before declaring UP. Prevents flapping on transient failures.
Static route with tracking
ip route 0.0.0.0 0.0.0.0 10.1.1.1 track 1
ip route 0.0.0.0 0.0.0.0 10.2.2.1 10
Primary default route via 10.1.1.1 is only active when track 1 is UP. Backup route (AD 10) via 10.2.2.1 takes over when track 1 goes DOWN.
HSRP with IP SLA tracking
interface GigabitEthernet0/1
standby 1 track 1 decrement 20
Reduces HSRP priority by 20 when track object 1 goes DOWN. Pair with preempt on standby router for automatic failover.
Verification and Troubleshooting
Show IP SLA configuration
show ip sla configuration
Displays all configured operations with their parameters, schedules, and status.
Show IP SLA statistics
show ip sla statistics
Shows latest probe results: RTT, jitter (SD/DS), packet loss, return code. The primary verification command.
Show IP SLA statistics (specific operation)
show ip sla statistics 1
Shows results for operation 1 only.
Show tracked objects
show track
Displays state (UP/DOWN) of all tracked objects with the reason for current state.
Show track brief
show track brief
One-line summary per tracked object.
Debug IP SLA
debug ip sla trace
debug ip sla error
Real-time probe diagnostics. Use during troubleshooting only — disable with ‘undebug all’ after.
Show IP SLA history
show ip sla enhanced-history
Shows historical probe data for trend analysis. Requires ‘history enhanced’ configured in the operation.
Leave a Reply